Methodology
Successful Together
Our clients trust us with a wide variety of projects because they value our many years of experience. After the briefing, the survey starts promptly, and within a very short time, our clients have the desired data in their hands. We will show you the procedure for our surveys using a sample project.
appJobber Workflow
Briefing
Assessment of the requirements
Scope of the market survey
Clarification of deadlines and costs
CROWD
External completion of tasks
Regional quotas
Interim meeting (if desired)
Analysis
Internal review of the evidence images
Correction and follow-up survey if necessary
Analysing and compiling the data
Reporting
Data transfer via download
Customised spreadsheet
Dashboard with visualisation
Project report as slide deck
Recommendations for action
Sample Project: Liquor Placement in the Checkout Area
Using an example, we’re happy to show you how appJobber collects and analyses information at the PoS,
Project Description
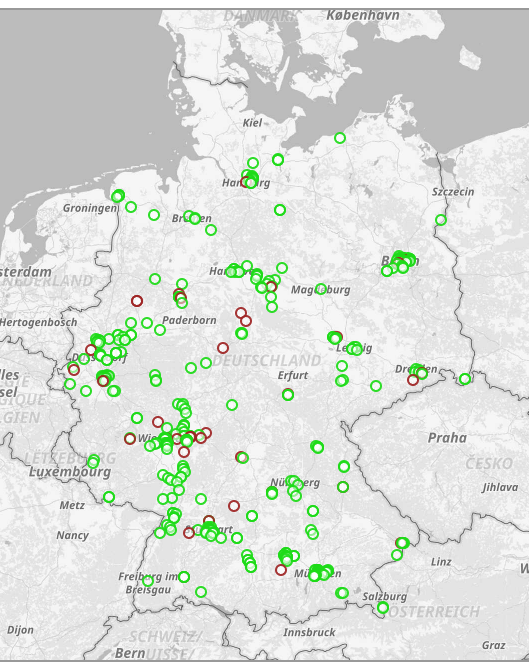
Due to a lack of distribution data on the frequency and quality of spirits placements in the checkout area, a leading spirits manufacturer chose to have a nationwide, statistically representative field survey carried out in the retail trade. A total of 1,400 shops were visited, divided between four food discounter chains with the largest market share.
Survey Objective
Number of checkout placements with spirits
Share and facings of all brands and size units
Extraction of prices per SKU
Run Time
4 weeks
including briefing, field survey and reporting
Jobber-provided Evidence
Overview photos of the situation at the checkout area
Detailed photos of the liquor placements at each checkout
Results
Of the four discounters, Discounter A is clearly lagging behind in terms of the availability of spirits at the checkout. Whilst discounters B to C have liquor checkout counters in 98.2 - 99.7 % of the stores visited, the rate at Discounter A is only 91.1 %.
The pattern is even clearer when it comes to the availability of the specific liquor brand sought for in this survey. Here, discounters B to C range between 91.8% and 96.8%. Only 80.8 % of the stores visited by Discounter A had the desired spirit at the checkout. There is an urgent need for the manufacturer to take action here.
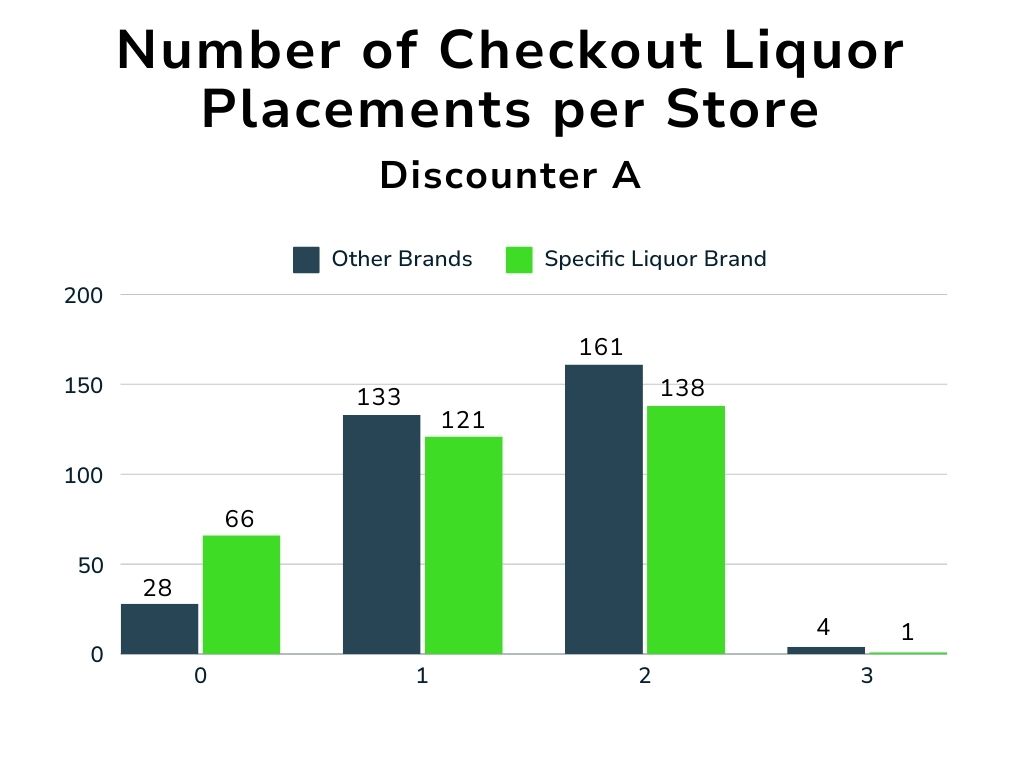
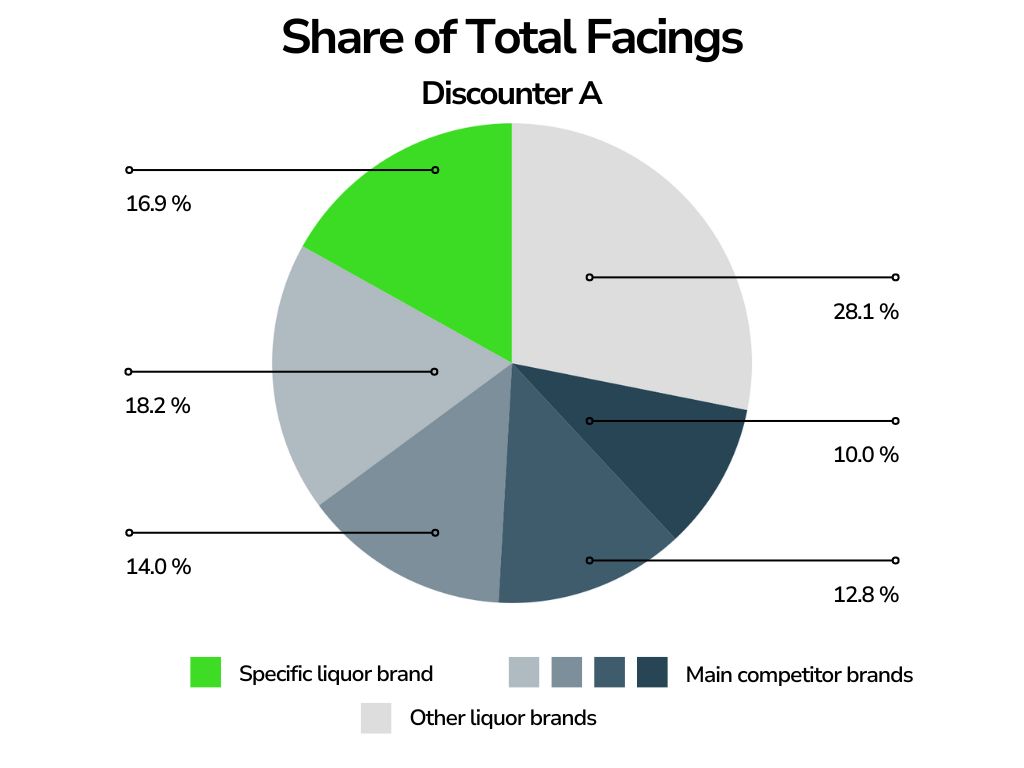
Looking at Discounter A in detail, it is noticeable that, despite the low placement rate, the specific liquor brand claims second place in the ranking of facings (16.9 %). So if it is available, it is extremely present in the competition with usually 2 facings per till. This makes it all the more important to improve the placement rate and expand this position.
- chart3 (Kopie 1)
- chart2
- Chart1 (Kopie 1)
These Clients Trust Us:


We Would Like to Impress You Too!
Every project has its own requirements and special characteristics. We are happy to discuss your requirements with you and draw up an offer that exactly matches your needs. We look forward to getting to know you and your company!